Relief
Supply
Vala
Rahmati and Halit Uster
A.
Computational
Study Data
The link
to download the instance data files used for computational study is given below
·
Computational
study Data Instances - Dataset.zip
There are
24 excel files representing classes C1 - C8 for 3 different networks G1 – G3,
and within each file there are 10 sheets representing instances that are
randomly generated. The folder names follow a particular naming convention to
help a user match easily:
Folder
name format: G[A]-C[B]-[C]-[D]-[E]-[F]-[G]-[H]
A: =
Utilized graph, B: = Class Number, C: = number of DCs, D: = number of transfer
nodes,
E: =
number of Shelters, F: = Time period, G: = number of relief items, H: = Number
of arcs.
For
example,
G2-C6-16-88-22-20-4-363 contains
10 instance sheets of class 6 applied on network 2 with 16 DCs, 88 transfer
nodes, 22 shelters, 20 time periods, 4 relief items, and 363 arcs.
Each
instance sheet within such a file is named as Ii where i = 1, …, 10 (index number).
We now
explain the content of a data file.
The legend
used in these data files is explained in the following table.
|
Symbol |
Details |
|
DC List [ID, X, Y,
Item1_Capacity, Item2_Capacity, Item3_Capacity, Item4_Capacity, Fixed Cost] |
DC ID, (x, y)
coordinates, Capacity of items stored in that DC, and fixed cost for opening
that DC. |
|
Transfer List [ID,
X, Y, Fixed Cost, Associated Preparation Cost] |
Transfer node ID,
(x, y) coordinates, fixed cost of utilizing that transfer node, and
associated preparation cost in transfer node. |
|
Shelter List [ID,
X, Y, Capacity] |
Shelter ID, (x, y)
coordinates, and the capacity of people hosted in that shelter. |
|
Arc List [Origin
ID, Destination ID, Fixed Cost, Variable Cost, Capacity, Distance] |
Arc’s origin node
ID, Arc’s destination node ID, fixed cost of utilizing that arc,
transportation cost of using that arc, arc capacity for relief items,
Distance between origin and destination of that arc. |
B.
Case
Study Data
The case
study data are available in the folder GIS-data within dataset.zip. In this
folder, all model parameters are given in Excel files, labeled as follows:
·
DC
Data: All data related to distribution centers are stored in this excel file.
|
Header |
Description |
|
ID |
ID
of DC |
|
CNTY_NM |
County
that DC |
|
Population |
Population
of DC county |
|
X |
X-coordinates |
|
Y |
Y-coordinates |
|
Capacity_Item1 |
Capacity
of item 1 in DC |
|
Capacity_Item2 |
Capacity
of item 2 in DC |
|
Capacity_Item3 |
Capacity
of item 3 in DC |
|
Capacity_Item4 |
Capacity
of item 4 in DC |
|
Fixed_Cost |
Fixed
cost of opening DC |
·
Transfer
Data: All data related to transfer nodes are stored in this excel file.
|
Header |
Description |
|
ID |
ID
of transfer node |
|
X |
X-coordinates |
|
Y |
Y-coordinates |
|
Fixed_Cost |
Fixed
cost of utilizing transfer node |
|
Associated_Preparation_Cost |
Preparation
cost of using transfer nodes |
·
Shelter
Data: All data related to shelters are stored in this excel file.
|
Header |
Description |
|
ID |
ID
of shelter |
|
X |
X-coordinates |
|
Y |
Y-Coordinates |
|
County |
County
of shelter |
|
Capacity |
Capacity
of shelter for evacuees |
·
Arc
Data: All data related to arcs are stored in this excel file.
|
Header |
Description |
|
Origin
Node |
Origin
node of arc |
|
Destination
Node |
Destination
node of arc |
|
Fixed
Cost |
Fixed
cost of utilizing arc |
|
Variable
Cost |
Relief
transportation cost through this arc |
|
Capacity |
Capacity
of arc |
|
Distance |
Origin-destination
distance of arc |
We use the
following counties given in the figure below, to construct the shelter and DC zones
respectively.
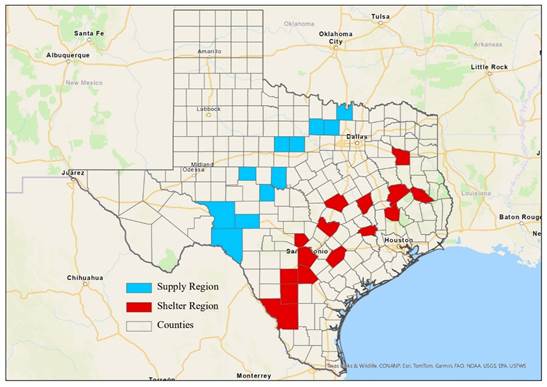
Detailed
information about these regions is given in the following table.
|
Supply Region |
Shelter Region |
||
|
County |
Population |
County |
Population |
|
Coke |
3,285 |
Angelina |
86,396 |
|
Coleman |
7,684 |
Atascosa |
48,981 |
|
Concho |
3,303 |
Bell |
370,647 |
|
Cooke |
41,668 |
Bexar |
2,009,324 |
|
Crockett |
3,098 |
Frio |
18,385 |
|
Jack |
8,472 |
Gonzales |
19,653 |
|
Shackelford |
3,105 |
Houston |
22,066 |
|
Stephans |
9,101 |
Kendall |
44,279 |
|
Sutton |
3,372 |
La Salle |
50,088 |
|
Val Verde |
47,586 |
Robertson |
16,757 |
|
Wise |
68,632 |
Smith |
233,479 |
|
|
|
Travis |
1,290,188 |
|
|
|
Walker |
76,400 |
|
|
|
Washington |
35,805 |
|
|
|
Webb |
267,114 |
Candidate
DCs and shelters are considered in centroid of selected regions, respectively.