Using FusionCharts with C# (ASP.NET) > Plotting data from a database
In this section, we'll show you how to use FusionCharts and ASP.NET to plot charts from data contained in a database. We'll create a pie chart to show "Production by Factory" using:
- dataXML method first.
- Thereafter, we'll convert this chart to use dataURL method.
For the sake of ease, we'll use an Access Database. The database is present in Download Package > Code > VBNET > DB folder. You can, however, use any database with FusionCharts including MS SQL, Oracle, MySQL etc.
Before you go further with this page, we recommend you to please see the previous section "Basic Examples" as we start off from concepts explained in that page.
The code examples contained in this page are present in Download Package > Code > CNET > DBExample folder. The Access database is present in Download Package > Code > CNET > DB.
The database contains just 2 tables:
- Factory_Master: To store the name and id of each factory
- Factory_Output: To store the number of units produced by each factory for a given date.
For demonstration, we've fed some dummy data in the database. Let's now shift our attention to the ASP.NET page that will interact with the database, fetch data and then render a chart.
<%@ Page Language="C#" AutoEventWireup="false" CodeFile="BasicDBExample.aspx.cs" Inherits="DBExample_BasicDBExample" %>
<HTML>
<HEAD>
<TITLE> FusionCharts Free - Database Example </TITLE>
<%
//You need to include the following JS file, if you intend to embed the chart using JavaScript.
%>
<SCRIPT LANGUAGE="Javascript" SRC="../FusionCharts/FusionCharts.js"></SCRIPT>
</HEAD>
<BODY>
<%=CreateChart() %>
</BODY>
</HTML>
using System;
using System.Data;
using System.Configuration;
using System.Collections;
using System.Web;
using System.Web.Security;
using System.Web.UI;
using System.Web.UI.WebControls;
using System.Web.UI.WebControls.WebParts;
using System.Web.UI.HtmlControls;
using DataConnection;
using InfoSoftGlobal;
public partial class DBExample_BasicDBExample : System.Web.UI.Page
{
public string CreateChart()
{
//In this example, we show how to connect FusionCharts to a database.
//For the sake of ease, we've used an Access database which is present in
//../App_Data/FactoryDB.mdb. It just contains two tables, which are linked to each
//other.
//Database Objects - Initialization
DbConn oRs; string strQuery;
//strXML will be used to store the entire XML document generated
string strXML;
//Generate the graph element
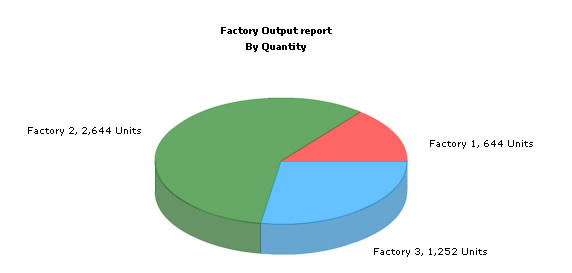
strXML = "<graph caption='Factory Output report' subCaption='By Quantity' decimalPrecision='0' showNames='1' numberSuffix=' Units' pieSliceDepth='30' formatNumberScale='0'>";
//Iterate through each factory
strQuery = "select * from Factory_Master";
oRs = new DbConn(strQuery);
while(oRs.ReadData.Read())
{
//Now create second recordset to get details for this factory
strQuery = "select sum(Quantity) as TotOutput from Factory_Output where FactoryId=" + oRs.ReadData["FactoryId"].ToString();
DbConn oRs2 = new DbConn(strQuery);
oRs2.ReadData.Read();
//Generate <set name='..' value='..' />
strXML += "<set name='" + oRs.ReadData["FactoryName"].ToString() + "' value='" + oRs2.ReadData["TotOutput"].ToString() + "' />";
//Close recordset
oRs2.ReadData.Close();
}
oRs.ReadData.Close();
//Finally, close <graph> element
strXML += "</graph>";
//Create the chart - Pie 3D Chart with data from strXML
return FusionCharts.RenderChart("../FusionCharts/FCF_Pie3D.swf", "", strXML, "FactorySum", "650", "450", false, false);
}
}
The following actions are taking place in this code:
- We first include DataConnection and InfoSoftGlobal namespace. DataConnection namespace is contained within DataConn VB.NET class inside App_Code folder of Download pack. It contains the connection parameters to connect to Access database. And InfoSoftGlobal namespace is from FusionCharts.dll file in bin directory.
- We declare variables strQuery to store SQL query that fetches data from database and strXML to store XML data.
- Thereafter, we generate the XML data document by iterating through the recordset and store it in strXML variable.
- Finally, we render the chart using RenderChart() method and pass strXML as dataXML.
When you now run the code, you'll get an output as under:
Let's now convert this example to use dataURL method. As previously explained, in dataURL mode, you need two pages:
- Chart Container Page - The page which embeds the HTML code to render the chart. This page also tells the chart where to load the data from. We'll name this page as Default.aspx.
- Data Provider Page - This page provides the XML data to the chart. We'll name this page as PieData.aspx.
The pages in this example are contained in Download Package > Code > CNET > DB_dataURL folder.
<%@ Page Language="C#" %>
<%@ Import Namespace="InfoSoftGlobal" %>
<script runat="server">
</script>
<HTML>
<HEAD>
<TITLE>
FusionCharts Free - dataURL and Database Example
</TITLE>
<%
//You need to include the following JS file, if you intend to embed the chart using JavaScript.
%>
<SCRIPT LANGUAGE="Javascript" SRC="../FusionCharts/FusionCharts.js"></SCRIPT>
</HEAD>
<BODY>
<%
//In this example, we show how to connect FusionCharts to a database
//using dataURL method. In our other examples, we've used dataXML method
//where the XML is generated in the same page as chart. Here, the XML data
//for the chart would be generated in PieData.aspx.
//For the sake of ease, we've used an Access database which is present in
//../App_Data/FactoryDB.mdb. It just contains two tables, which are linked to each
//other.
//Variable to contain dataURL
Dim strDataURL as string
//the ASP.NET script in piedata.aspx interacts with the database,
//converts the data into proper XML form and finally
//relays XML data document to the chart
strDataURL = "PieData.aspx"
//Create the chart - Pie 3D Chart with dataURL as strDataURL
Response.Write(FusionCharts.RenderChart("../FusionCharts/FCF_Pie3D.swf", strDataURL, "", "FactorySum", "650", "450", False, False))
%>
</BODY>
</HTML>
In the above code, we:
- Include InfoSoftGlobal namespace and FusionCharts.js JavaScript class.
- Create the dataURL string and store it in strDataURL variable.
- Finally, we render the chart using RenderChart() method and set dataURL as strDataURL.
<%@ Page Language="C#" Debug="true" %>
<%@ Import Namespace="DataConnection" %>
<script runat="server">
Protected Sub Page_Load(ByVal obj As Object, ByVal e As EventArgs)
//This page generates the XML data for the Pie Chart contained in
//Default.aspx.
//For the sake of ease, we've used an Access database which is present in
//../App_Data/FactoryDB.mdb. It just contains two tables, which are linked to each
//other.
//Database Objects - Initialization
Dim oRs As DbConn, strQuery As String
//strXML will be used to store the entire XML document generated
Dim strXML As String
//Generate the graph element
strXML = "<graph caption='Factory Output report' subCaption='By Quantity' decimalPrecision='0' showNames='1' numberSuffix=' Units' pieSliceDepth='30' formatNumberScale='0'>"
//Iterate through each factory
strQuery = "select * from Factory_Master"
oRs = New DbConn(strQuery)
While oRs.ReadData.Read()
//Now create second recordset to get details for this factory
strQuery = "select sum(Quantity) as TotOutput from Factory_Output where FactoryId=" & oRs.ReadData("FactoryId").ToString()
Dim oRs2 As New DbConn(strQuery)
oRs2.ReadData.Read()
//Generate <set name='..' value='..'/>
strXML = strXML & "<set name='" & oRs.ReadData("FactoryName").ToString() & "' value='" & oRs2.ReadData("TotOutput").ToString() & "' />"
//Close recordset
oRs2.ReadData.Close()
End While
oRs.ReadData.Close()
//Finally, close <graph> element
strXML = strXML & "</graph>"
//Set Proper output content-type
Response.ContentType = "text/xml"
//Just write out the XML data
//NOTE THAT THIS PAGE DOESN'T CONTAIN ANY HTML TAG, WHATSOEVER
Response.Write(strXML)
End Sub
</script>
In the above page:
- Include DataConnection Namespace to fetch data from database.
- We generate the data and store it in strXML variable
- Finally, we write this data to output stream without any HTML tags.
When you view this page, you'll get the same output as before.
using System;
using System.Data;
using System.Data.Odbc;
using System.Web;
namespace DataConnection
{
/// <summary>
/// Summary description for DbHelper.
/// </summary>
public class DbConn
{
// Create a database Connection. using here Access Database
// Return type object of OdbcConnection
public OdbcConnection connection;
public OdbcDataReader ReadData;
public OdbcCommand aCommand;
public DbConn(string strQuery)
{
// Setup Connection string For Access DataBase
string ConnectionString = "Driver={Microsoft Access Driver (*.mdb)};Dbq=" + HttpContext.Current.Server.MapPath("..\\App_Data\\FactoryDB.mdb");
// We are specifying the path of the MS Access database here. If your Database is at a
// different location, you need to specify it here.
// Setup Connection string For SQL Server DataBase; to connect to SQL Server Database,
// activate the line below and deactivate the line to connect to MS Access Database
//string ConnectionString = "Driver={SQL Server};;uid=sa;pwd=;server=Infosoft;database=FactoryDB";
connection = new OdbcConnection();
connection.ConnectionString = ConnectionString;
connection.Open();
GetReader(strQuery);
}
// Create an instance dataReader
// Return type object of OdbcDataReader
public void GetReader(string strQuery)
{
// Create a Command object
aCommand = new OdbcCommand(strQuery, connection);
// Create data reader object using strQuery string
ReadData = aCommand.ExecuteReader(CommandBehavior.CloseConnection);
}
}
}
- Set up Connection to sample MS Access Database.
- The code to connect to SQL Server Database is also given in comment form. To connect to SQL Server you have activate the corresponding code.
- It accepts SQL Query, executes it and returns the result.