|
|
 |
||
|
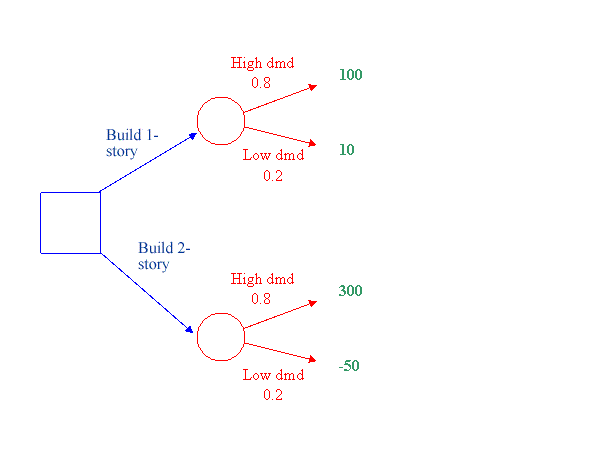
DTree analyzes decision trees and determines the optimal set of decisions based on expected values.A decision tree consists of a set of (a) decision nodes with decision branches or arcs, (b) chance event nodes with event branches, and (c) payoffs to be received from a series of decisions and events. Example. An engineering manager must decide whether to build a one- or two-story facility. The payoff from each choice depends on whether demand is high or low, and the P(high) = .8 and P(low) = .2. The tree can be depicted as follows, with the decision nodes and arcs/branches in blue, the event nodes and arcs in red, and the payoffs in green.
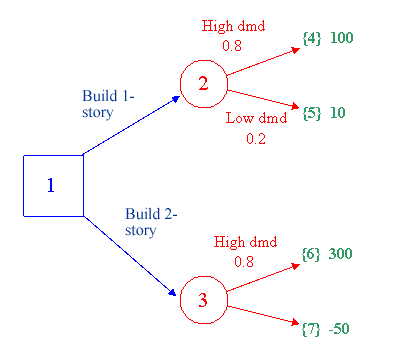
By adding nodes for each payoff and numbering the nodes, starting with 1, the decision tree input to DTree is as follows.
Model Input Requirements DTree input consists of a list of arcs from this expanded tree, one arc or branch per line, plus one line for each payoff, as follows: Decision branch or arc: D fromnode tonode arcid description where
Limits: program is limited to 99 nodes (decision nodes, chance event nodes, payoffs) and 98 arcs. DTree Output DTree analyzes the problem and gives the following:
DTree input data for above example: D 1 2 Bld1 Build one-story |
||
| [Home] [LP] [Networks] [Decision Analysis] [DTree] [Stochastic] [Forecasting] |

