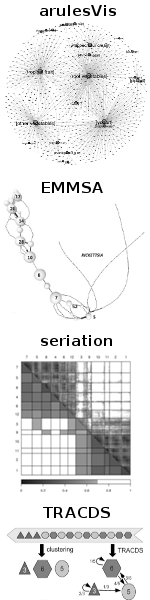
seriation: Reordering in Visualization
Reordering matrices is a long known technique. For example Jacques Bertin devoted a whole chapter of his book "Graphics and Graphic Information Processing" to this topic. More recently matrix reordering was applied to mosaic displays for multi-way contingency tables, distance matrices, correlation matrices, and scatter plot matrices. For these applications reordering is typically done using heuristics.
We are interested in applying efficient algorithms recently developed by Brusco and Stahl for the seriation problem to visualization and develop new reordering-based visualization techniques.
A detailed treatment and an application for cluster visualization can be found in the preprint of Dissimilarity Plots: A Visual Exploration Tool for Partitional Clustering (published in the Journal of Computational and Graphical Statistics).
Team
M. Hahsler, K. Hornik, C. Buchta and P. Thainiam
Developed Software
- seriation:
Infrastructure for seriation with an implementation of several
seriation/sequencing techniques to reorder matrices, dissimilarity matrices,
and dendrograms.
[
description
]

- TSP:
Basic infrastructure and some algorithms for the traveling salesperson problem
(TSP). The package provides some simple algorithms and an interface to
Concorde, currently the fastest TSP solver
for the Traveling Salesperson Problem.
[
description
]
- QAP:
Implements heuristics for the Quadratic Assignment Problem (QAP). Currently only a simulated annealing heuristic is available.
Publications
- [1]
- Michael Hahsler. An experimental comparison of seriation methods for one-mode two-way data. European Journal of Operational Research, 257:133--143, February 2017. [ DOI | .pdf ]
- [2]
- Michael Hahsler and Kurt Hornik. Dissimilarity plots: A visual exploration tool for partitional clustering. Journal of Computational and Graphical Statistics, 10(2):335--354, June 2011. [ DOI | .pdf ]
- [3]
- Michael Hahsler, Kurt Hornik, and Christian Buchta. Getting things in order: An introduction to the R package seriation. Journal of Statistical Software, 25(3):1--34, March 2008. [ DOI | at the publisher ]
- [4]
- Michael Hahsler and Kurt Hornik. TSP -- Infrastructure for the traveling salesperson problem. Journal of Statistical Software, 23(2):1--21, December 2007. [ DOI | at the publisher ]